De-polarization of the House of Representatives?

In updating some graphs today, I discovered something interesting (but not entirely unexpected). The House of Representatives appears to be de-polarizing.

Why? COVID-19 stimulus bills, “ends-against-the-middle” voting (one, two), something else?

Of course, it’s also possible that this is just a blip.

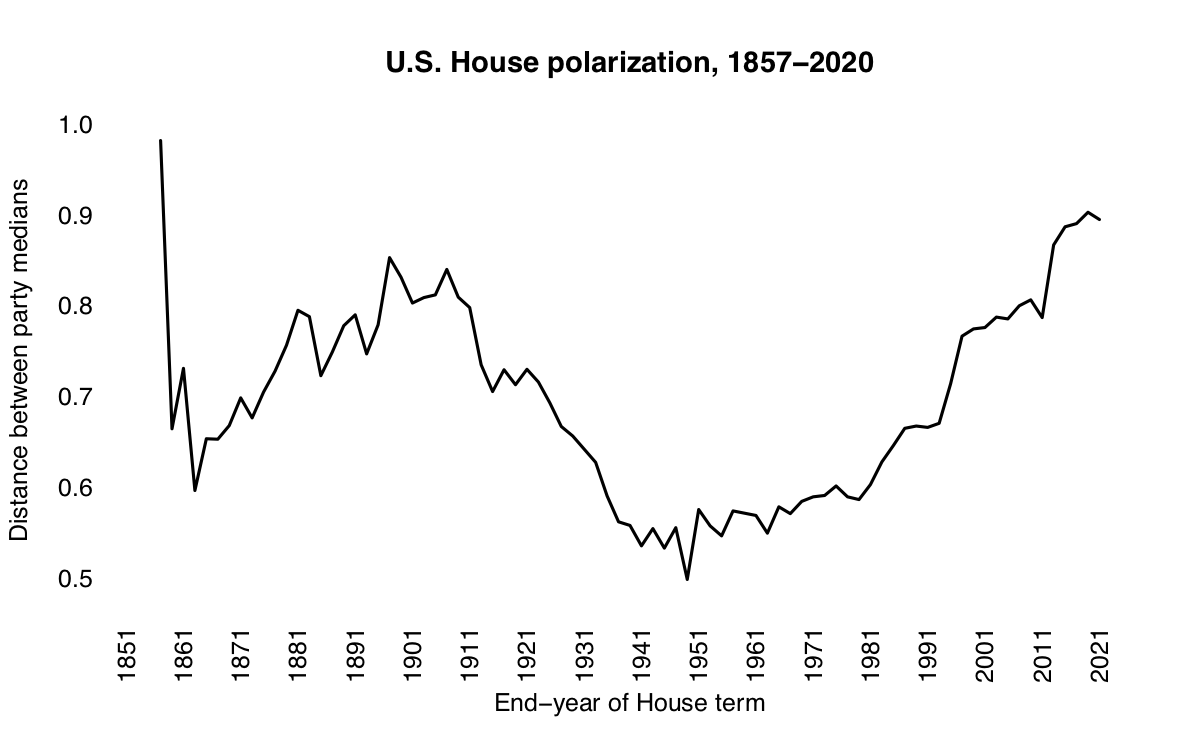
The graphs begin in 1856-7, which is the first session with both Republicans and Democrats in the House (data). Here is the usual plot, based on distances between the party medians:

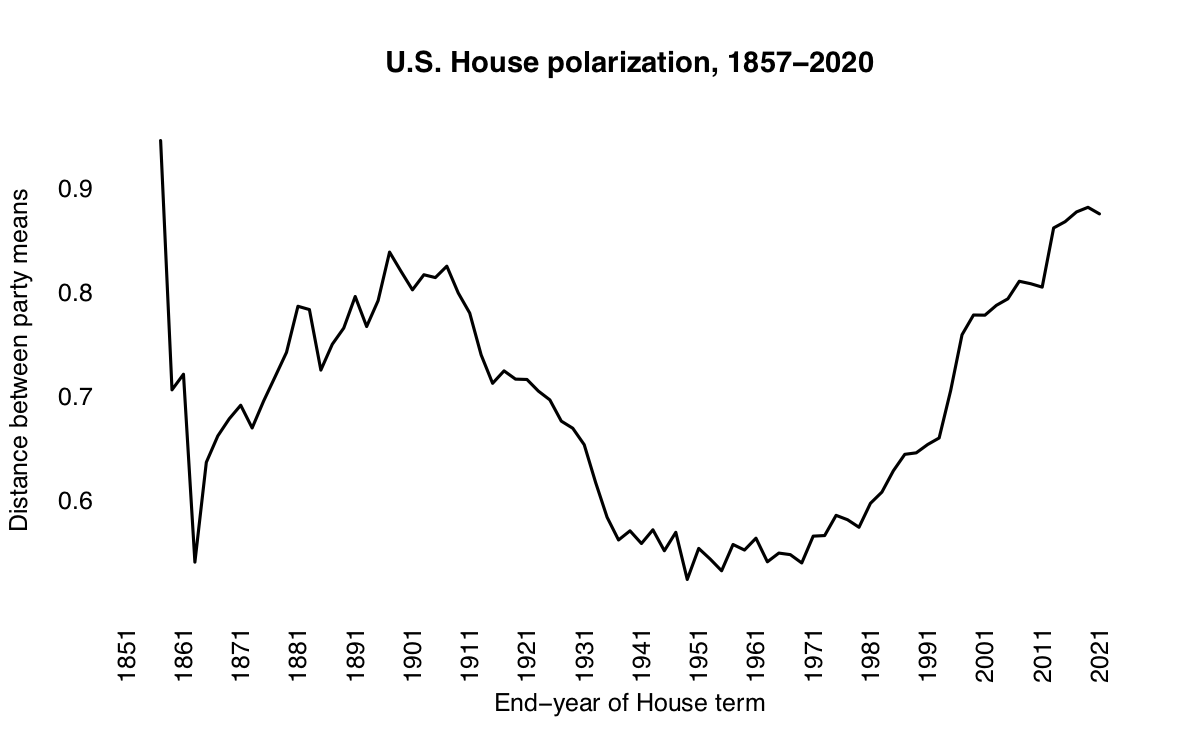
And here is another with distances between the party means:

Thanks to Dr. Jennie Sweet-Cushman for the prod.

STV is also totally compatible with polarization

On Friday, I showed NOMINATE scores for Cincinnati City Council members elected under permissive rules. Polarization was super low* for some years because, in each of those years, a lone wolf was able to play coalition kingmaker in a hung parliament.**

Now look at 1947, which is new in this plot, and watch those parties diverge. Yup. STV is totally compatible with high levels of polarization. (I never said it wasn’t.)

cincyThru1947

Continue reading “STV is also totally compatible with polarization”