The week before Christmas brought two new studies of voter error under the Alternative Vote (Cormack 2023; Pettigrew and Radley n.d.). They revive a line of research that grew out of earlier adoptions in the San Francisco Bay Area (Neely and Cook 2008; Neely and McDaniel 2015; McDaniel 2016). The basic finding in all these studies is that error concentrates in neighborhoods with low levels of educational attainment and other markers of low socioeconomic status.
This is a major problem for electoral reform. Taking the objections seriously means coming to terms with the possibility that electoral reform itself is a type of democratic backslide. And yet there is much demand for reform, which is both prior to and probably will outlast Trump.
The purpose of this post is to collect thoughts on the problem. I have been working on it, in one way or another, since finishing my book manuscript in late 2021. The book itself began to propose a solution, not just stop at identifying problems, and has drawn ire as a result. That solution was a list system with single candidate vote, more commonly known as open-list proportional representation (OLPR). Its single-seat “version” might be called open fusion.
One set of thoughts worth sharing is about why I started to take this issue seriously.
Part of the issue is my general desire to problem-solve. In turn, that was related to how I saw the reform community reacting to the research on voter error. I mean “reform community” expansively, such that it covers the large range of activists and scholars who want to see AV “work” in the U.S. One reaction is to change the subject and assert that AV elects more politicians from marginalized backgrounds. That assertion is not holding up to scholarly scrutiny, and it doesn’t really address the objection anyway. Another reaction is to assert that the problem is temporary, that voters need time to learn, etc. Again, the assertion does not jive with the research (Pettigrew and Radley n.d.; Mott 1926). We also have evidence from Australia, which is particularly devastating because that country has used AV for over a century and has an entire federal agency whose job is to educate voters. So, clinging to the assertions above strikes me as dismissive of a set of concerns that comes up over and over, in different data sets from different countries and time periods.
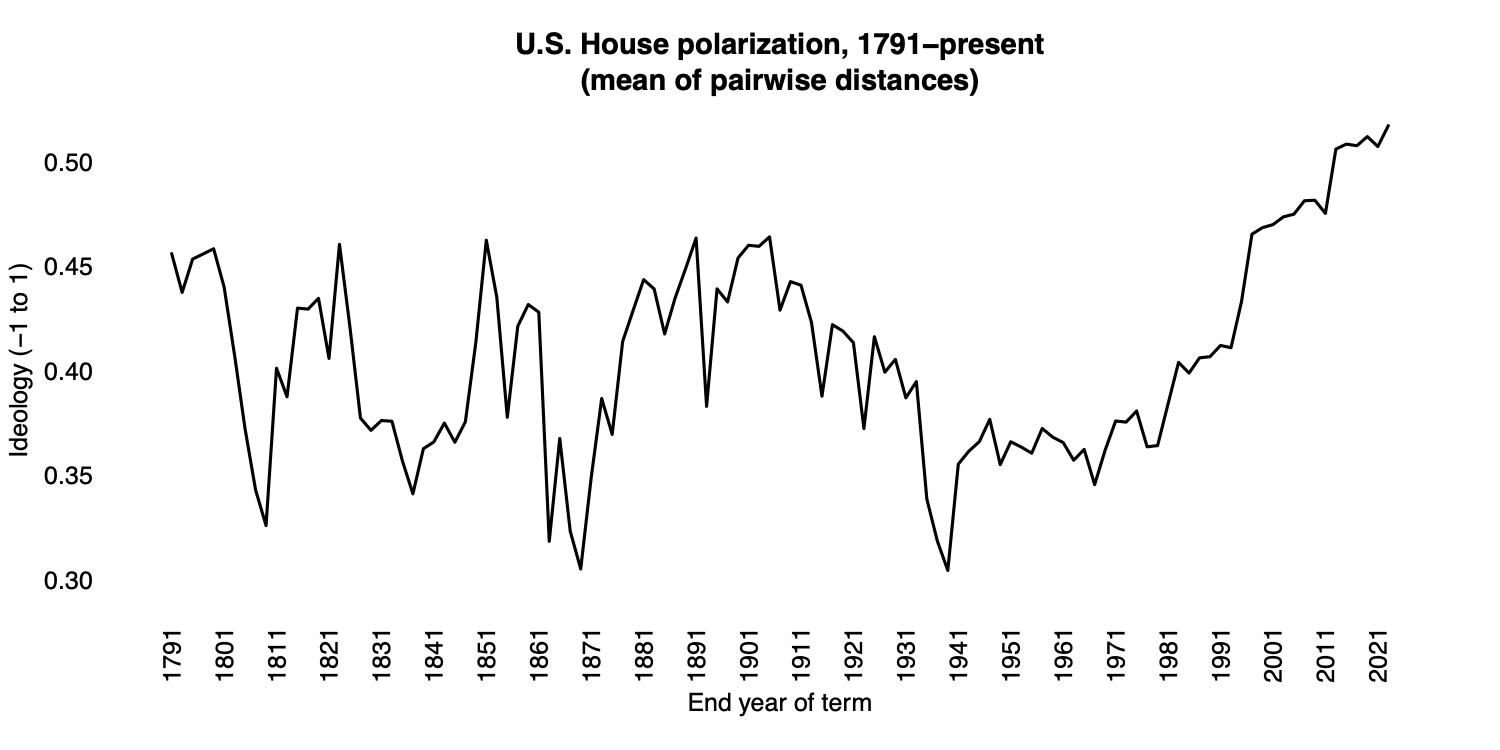
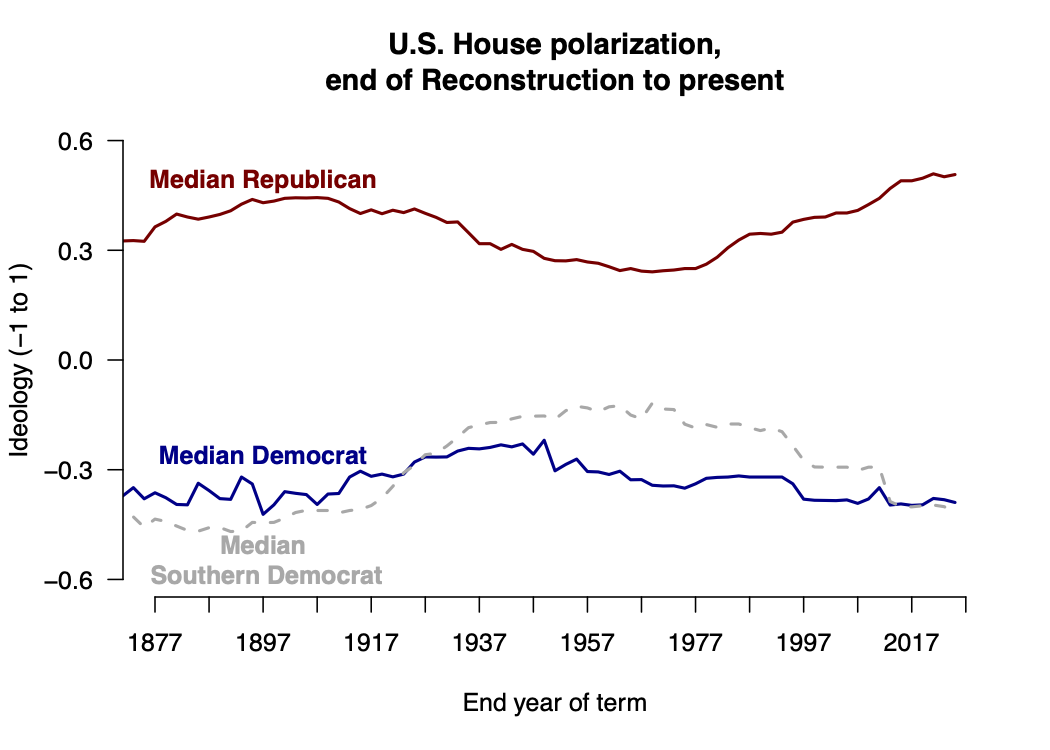
The other reason I started to take the issue seriously was a compelling theory of American voting rights. In that theory, voting rights can be described as a “suffrage regime” encapsulating laws, court decisions, and other practices that shape the overall cost of voting. That regime oscillates between expansion and what might be called “reactive sequences” (Valelly 2016). Reactive sequences intensify when the ‘party of voting rights’ is not able to use federal power to constrain state and local actors (Bateman 2016; also see Grumbach 2023). Overall polarization is due mainly to the party-system salience of race (Everson et al. 2016) but also to conflict over immigration (McCarty et al. 2007; Lee 2016). Calls for bipartisan action to “lower the political temperature” can thus be understood as systemic efforts to remove the causes of polarization from the electorate.
Three more notions have shaped my thinking. One is the observation, now a quarter century old, that ‘step one’ in passing historic electoral reforms was to contract the set of voters able to weigh in on those reforms (Bridges and Kronick 1999). Second is the finding that otherwise democracy-loving Americans are willing to curtail rights when some other ‘majoritarian’ project takes priority (Grossman et al. 2021). Third is a conversation I had several years ago with a prominent scholar of race and ethnic politics. In that conversation, reform-minded persons were described as “white liberals” who don’t take seriously concerns like the ones I’ve been writing down.
Where does all of this leave electoral reform? I don’t know, but here are some thoughts.
First, it could become untenable to assert that voter error is a temporary blip. There are now a lot of scholars working with the vast set of data from modern-day AV elections. Depending on how the literature evolves, it could become difficult to find political scientists willing to ‘say nice things’ about these reforms. (It has been interesting to see the growing number of scholars in non-political-science disciplines asking other kinds of questions about these reforms’ operation.)
Second, some may turn to other kinds of ‘multi-mark’ ballot, owing to the prevalence and perceived popularity of formally nonpartisan elections. Approval Voting is the most obvious candidate here. It is already making inroads in some corners of political science. While it does seem plausible to me that Approval ballots might be easier to use than ranked ones, (a) this has not been shown persuasively, (b) I think it misses the broader point about how parties prop up voting rights, and (c) Approval has not performed well in contexts with intense party competition.
Third — and I may have more to say on this as 2024 develops — I think it is possible to get several reform ‘benefits’ without also increasing the cost of voting. That would require a difficult decision to let go of nonpartisan elections, both where they already exist and where one might be tempted to expand their use. AV ‘works well’ in the long run where it is retooled for competition among parties and, maybe, when voters are required to mark at least two choices.
Fourth, the whole situation may evolve in the way it did 70-80 years ago. That might look like runoffs for single-seat elections, then cumulative or limited voting for multi-seat elections. One of those multi-seat options is more user-friendly than the other. All three, it should be noted, also face principled critiques on grounds that are similar to what I wrote above.
Overall, I do not want to be the go-to person for an anti-reform take. The point is that there seem to be real problems, and I am trying to take those seriously.