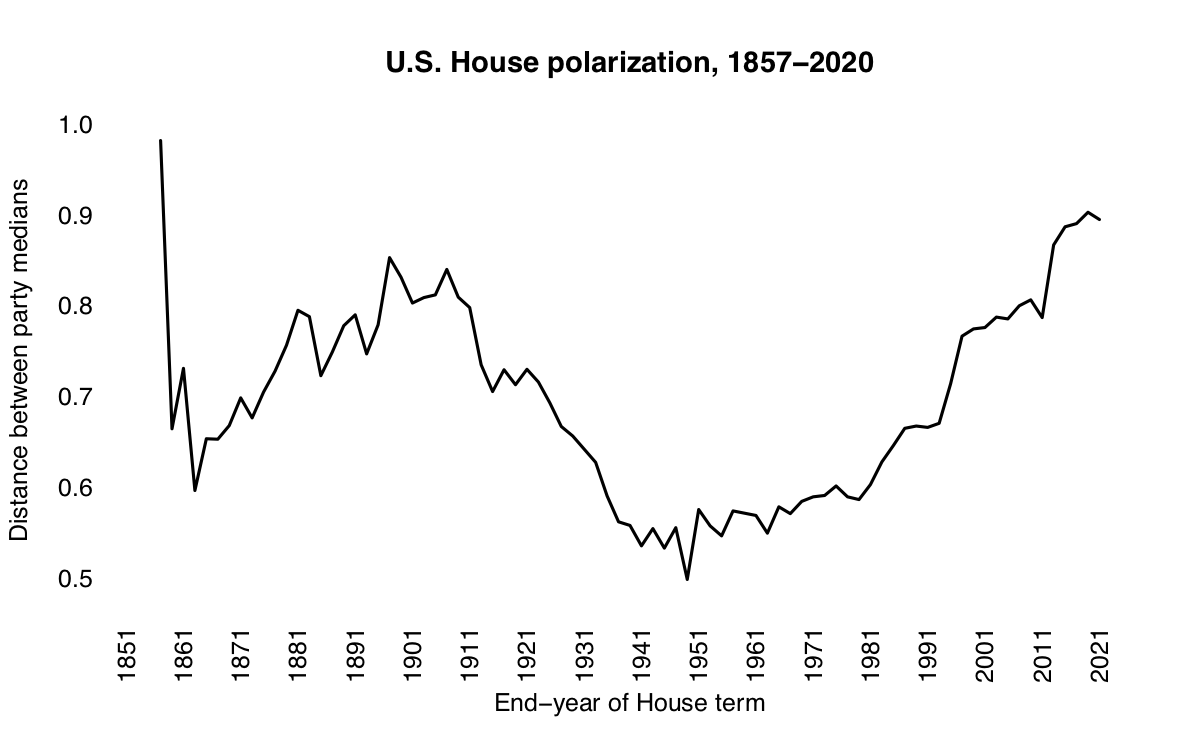
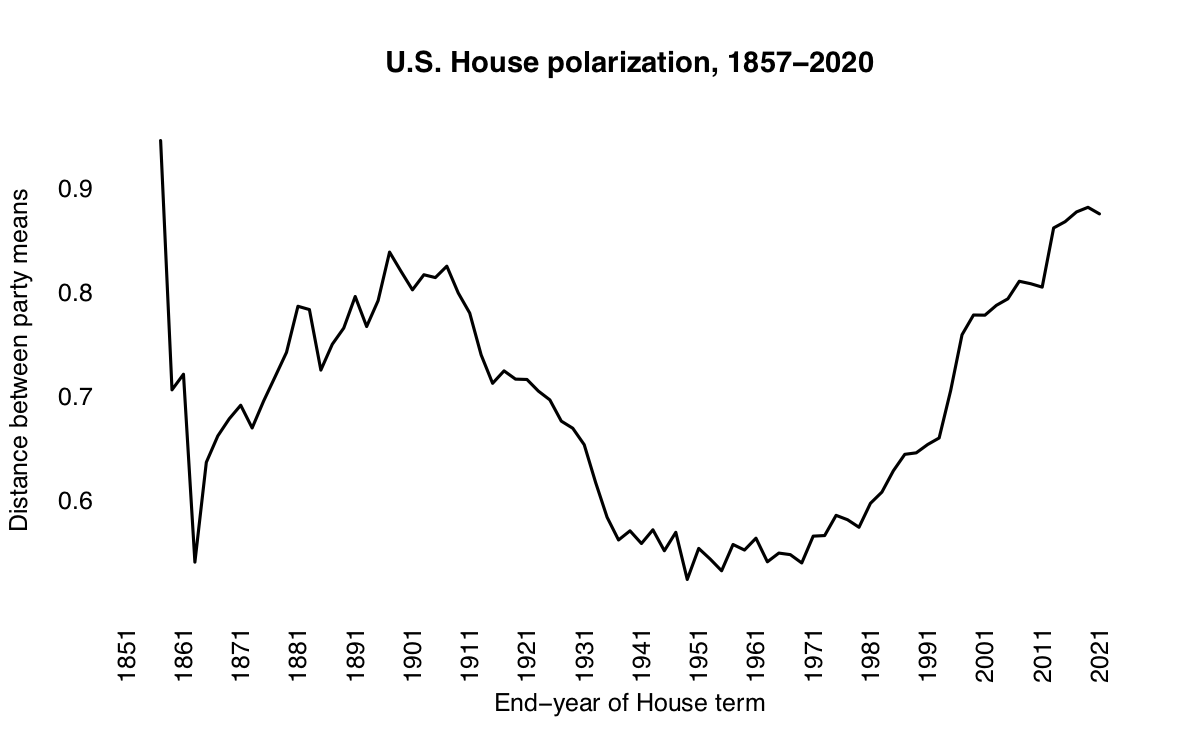
In updating some graphs today, I discovered something interesting (but not entirely unexpected). The House of Representatives appears to be de-polarizing.
Why? COVID-19 stimulus bills, “ends-against-the-middle” voting (one, two), something else?
Of course, it’s also possible that this is just a blip.
The graphs begin in 1856-7, which is the first session with both Republicans and Democrats in the House (data). Here is the usual plot, based on distances between the party medians:

And here is another with distances between the party means:

Thanks to Dr. Jennie Sweet-Cushman for the prod.