Mapping the repeal of proportional representation in New York City

I may have more to say about this later.

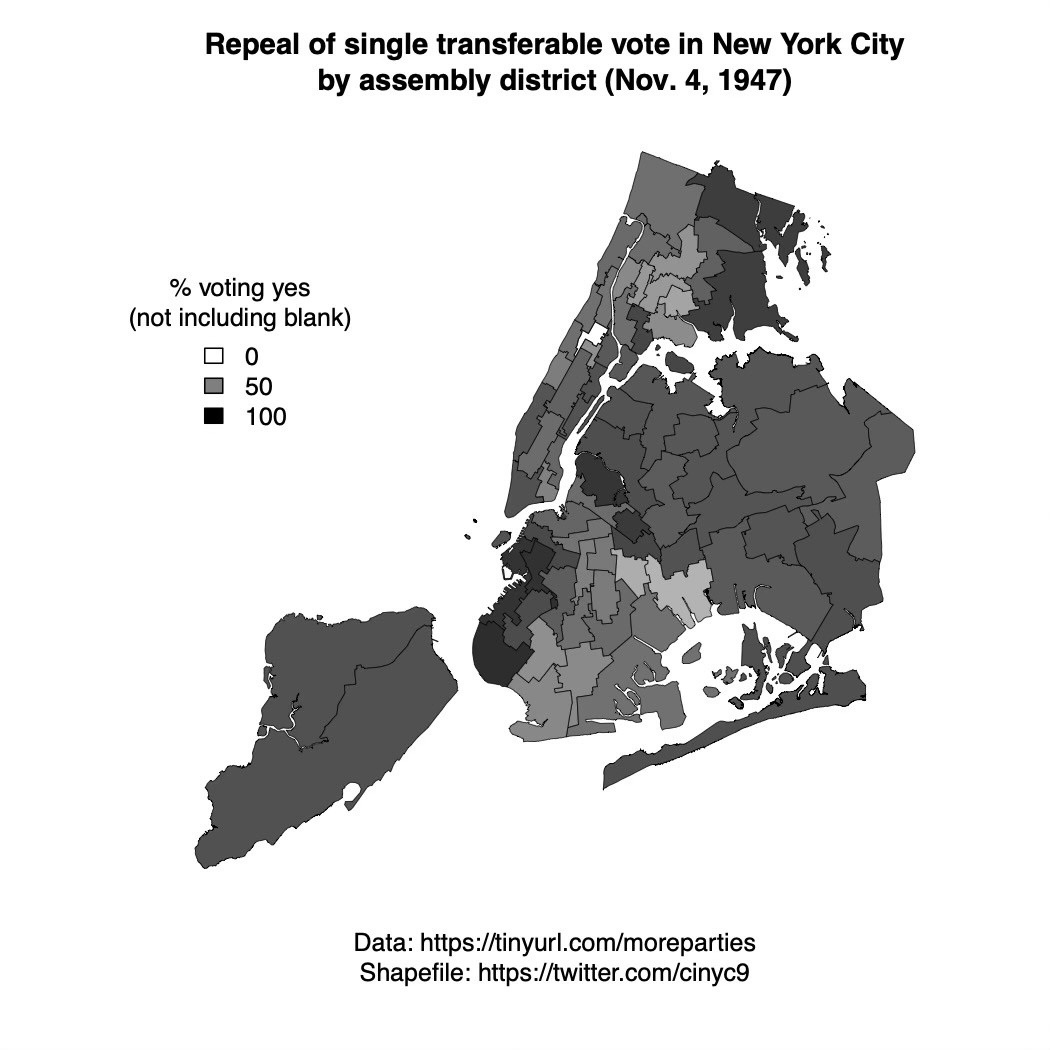
Two sorts of hypotheses might explain the variation. One concerns third-party strength (Labor, Liberal, Communist). But ecological inference suggests a divided Labor Party!

The other sort concerns politics of urban renewal. This may help explain the pockets of opposition in Bronx and Brooklyn. Also in the book, I analyze the City Council roll-call record. Those data suggest a faction of the Republican Party feuding with the O’Dwyer (D) administration and other Republicans on budget matters.

Another point worth mentioning: this was one of few repeals (the only?) that increased assembly size. So, there may be a counterintuitive representation story too.

Feel free to comment if anything strikes you.

The urban PR “spells” chart, updated

If you are reading this, you know that 24 U.S. cities tried the STV form of proportional representation. Here is an updated chart summarizing those episodes.

spells_25aug2015

The changes include:

1) Cropping to 1965, since events thereafter are basically chartjunk.

2) Adding a failed 1959 repeal attempt for Worcester, MA.

3) Changing the dates for Oak Ridge, TN, which evidence suggests to have emerged with STV a decade later than I thought. Note that the Oak Ridge council was “advisory,” whatever that means.

4) Adding Norris, TN, which I had not included because I could not find the dates of any STV elections. This Town Council was also “advisory.” Elections were held annually from 1937 through 1945. I cannot find evidence of an STV election post-1945. The federal government sold Norris to a developer in 1948, and Tennessee granted Norris its own charter in 1949.

5) Date-stamping, since this chart may evolve gain.

Please share any suggested, further changes. Wouldn’t it be nice if our state and local politics were better documented?