On June 9, Fargo (ND) held its first election under Approval Voting. It was the first such exercise for a U.S. public election, unless we count a variant used in the early republic. Fargo’s precinct-level data are available here. What follows is an attempt to make sense of those data.
[Note of 2020-12-23: I noticed that the link above (to the election data) had somehow become a second link to the “variant” paper. Here is a new link to the data page, and here is a link to a fresh data export. These data still do not include the total number of ballots.]
The election was nonpartisan, for two seats on the City Commission. There were seven declared candidates. Two (Strand and Grindberg) were incumbents. A third (Preston) had served in the 1990s. The winners were Strand and Preston. More information here.
According to this article, voters were asked to “Vote for ALL of the names you approve of.” This appears to conflict with what is said on the state website: “Vote For 2.” If I recall correctly from a Twitter conversation, the article has it right (not what’s implied on the state website).
One issue in approval voting is the extent to which voters “bullet vote” — or “truncate their approvals,” per the literature. I do not know this literature as well as I should. I do know, however, that this gets into larger issues about whether approval removes the need to vote strategically. We cannot tell, from the official data, how many voters “approved” of just one or two candidates. That is because the data do not include the total number of ballots cast, valid or otherwise.
A related issue is the extent to which approval voting avoids “center squeeze.” What does this mean? We start with a uni-dimensional model of politics. We then add in multi-candidate competition. (It may be that multi-candidate competition implies we need more than one dimension, but that is a separate issue.) As long as support for the centrist(s) is less than that for extremists, voters can be expected to desert centrists for extremists. This is said to hold for plurality, runoff, and instant runoff. With approval voting, however, there is no need to desert. Examples of this logic are here, here, and here.
Did the Fargo election reflect center squeeze? Part of the answer involves saying how much is too much. Approval advocates (see links above) tend offer the following standard: one of the extremists beats the centrist(s), even though most voters might have preferred the centrist(s). We do not have access to voters’ sincere preferences. But we can project the entire election onto a line — or more than one line, if that’s what comes from the data. I tried to do so using principal-components analysis. Observations are precincts, variables are candidates, and cell entries represent the percentage of votes (or “approvals”) for each candidate in that precinct. We are working with a 20×8 matrix (the last column of which is write-in).
Caveat: better ways to do this involve ballot-level data and formal models of voter decision. Nevertheless, the PCA with precincts may be instructive.
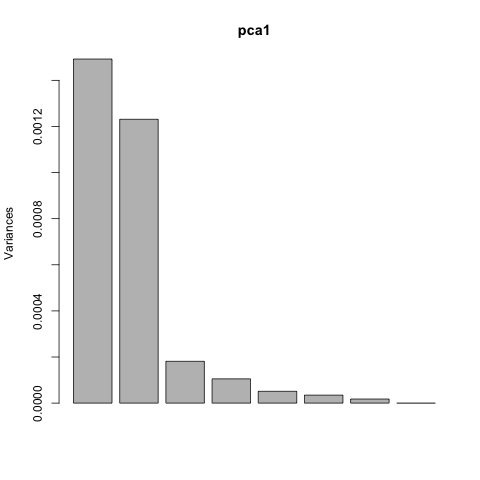
My first graph suggests a two-dimensional space (not one dimension, as in center-squeeze theory). Bars reflect the shares of overall variance in the data explained by each dimension.
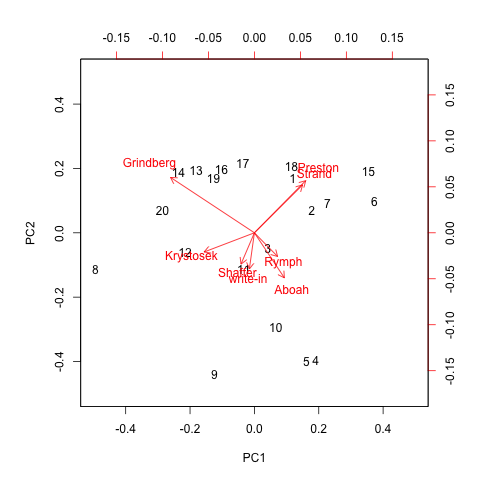
My second graph helps think about what defines the space. The length of each arrow along each dimension suggests how much each candidate (named at the end of each arrow) is related to that dimension. The first dimension clearly captures competition between incumbents (Strand and Grindberg). It also captures Preston, the former commissioner, who appears very close to Strand. The second dimension looks like a sort of anti-establishment one, picking up votes for candidates without (detectable) history on the Commission. But the first dimension also picks up division among these other candidates.
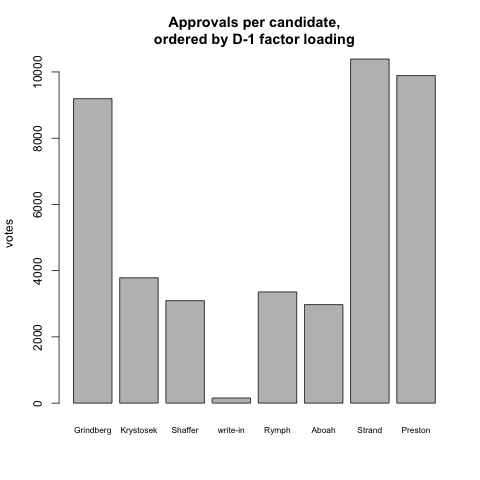
My last graph arrays candidates from left to right, along the main dimension (using their factor loadings). This is not a statement about how substantively liberal or conservative anyone is. It is simply the first dimension that emerges from the data. Note that the two winners, Strand and Preston, anchor the “right” of this space. Based on this graph and the preceding one, it really looks like they campaigned as a team. I’d be interested to know if they did, and if so, what that looked like.
So, did the center get squeezed? By the winner metric, yes, at least given these data. By a voter-desertion metric, it is impossible to say. We don’t have access to preference orderings, nor to the data on “bullet voting.” And I am reluctant to talk about a “center” at all. What I see in these data are two opposing coalitions — one defined by Grindberg, then a second by Strand/Preston.
If there are two winners and people tend 2 vote 4 two candidates, the tendency will be very similar to FPTP. Center squeeze is less of a problem when parties’ positions or voters preferences over candidates are endogenous, as tends to be true in real life but not in the pseudo-experimental Bayesian regret models that predict optimal performance from approval or range/score-voting.