This post updates a graphic I produced in June 2021. I have added data from the Australian Electoral Commission for 2018 and 2022, as well as a line indicating the adoption of compulsory voting.
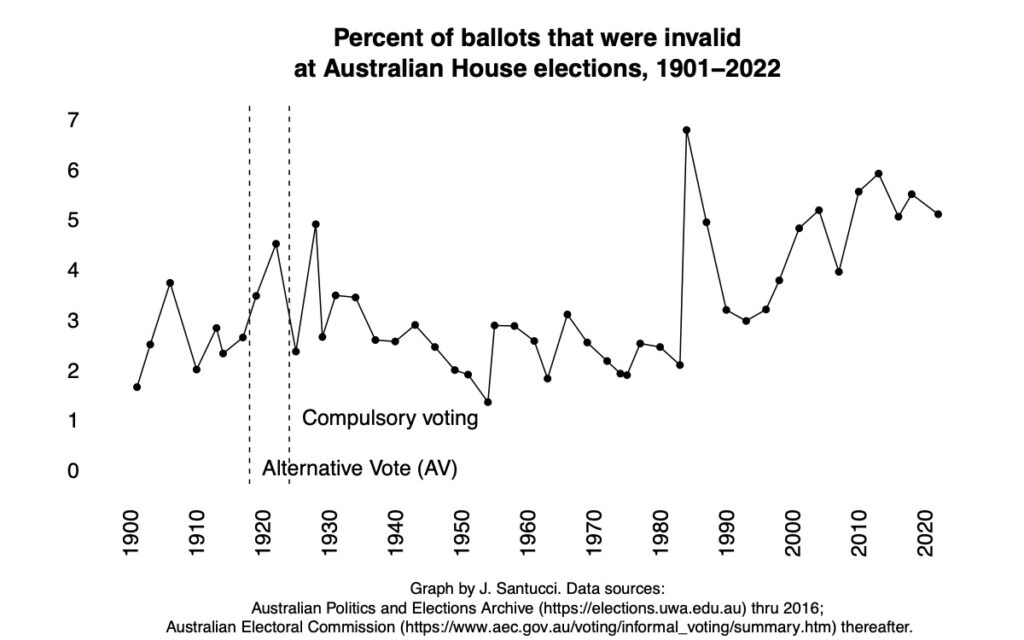
Invalidity in recent years seems to hover around 5 percent. That figure is consistent with figures from research on the United States. Some of it is recent, and some of it is quite old.
Two potential explanations stand out: voter confusion and refusal to follow compulsory-ranking instructions (see especially p. 9 here).
Data for the graph are here. The data up to 2016 used to be available here.
2 comments on “Ballot invalidity, Australian House of Representatives”