I just discovered several papers on the determinants of ballot invalidity (informal voting) in Australia. Two recent conversations prompted me to look for these. The overarching issue is whether an invalid ballot reflects confusion or protest voting. You can find the papers in my reference list. The answer seems to be: both but more of the latter, especially among young people dissatisfied with the party system.
I have a new post on 3streams. It responds to an influential graph on the basis of some findings I published (with Joshua Dyck) in 2022.
Long-time readers will be familiar with this project. For the post, I took a second look at the ‘social’ attitudes of people we might think would appear in the top-left of the above.
Here is a simple explanation of what I mean by “coordination failure.” If you are reading this, you may have heard the term come up in discussions of certain electoral reforms. Here is some of I what I’ve written about the problem. I will give a simpler explanation below.
Two repeal cases have been subject to ballot-level analysis, and results are consistent with a predictability story. In Pierce County, Alvarez et al. (2018) found a two-dimensional structure in rankings from the CFB [come-from-behind] race. One dimension was partisanship, and they term the other “preference for independence.” Because there was only one independent in the race, the orthogonal dimension suggests a candidate whose ballots did not flow reliably to either side. Similarly, in Burlington, AV critics have long argued that “the system failed” to elect a Condorcet winner. This suggests lack of coordination along the dimension that was salient to most voters (cf. Nagel 2006). Hence critics conclude that Burlington’s repeal was due to “the surprise outcome of the election.”
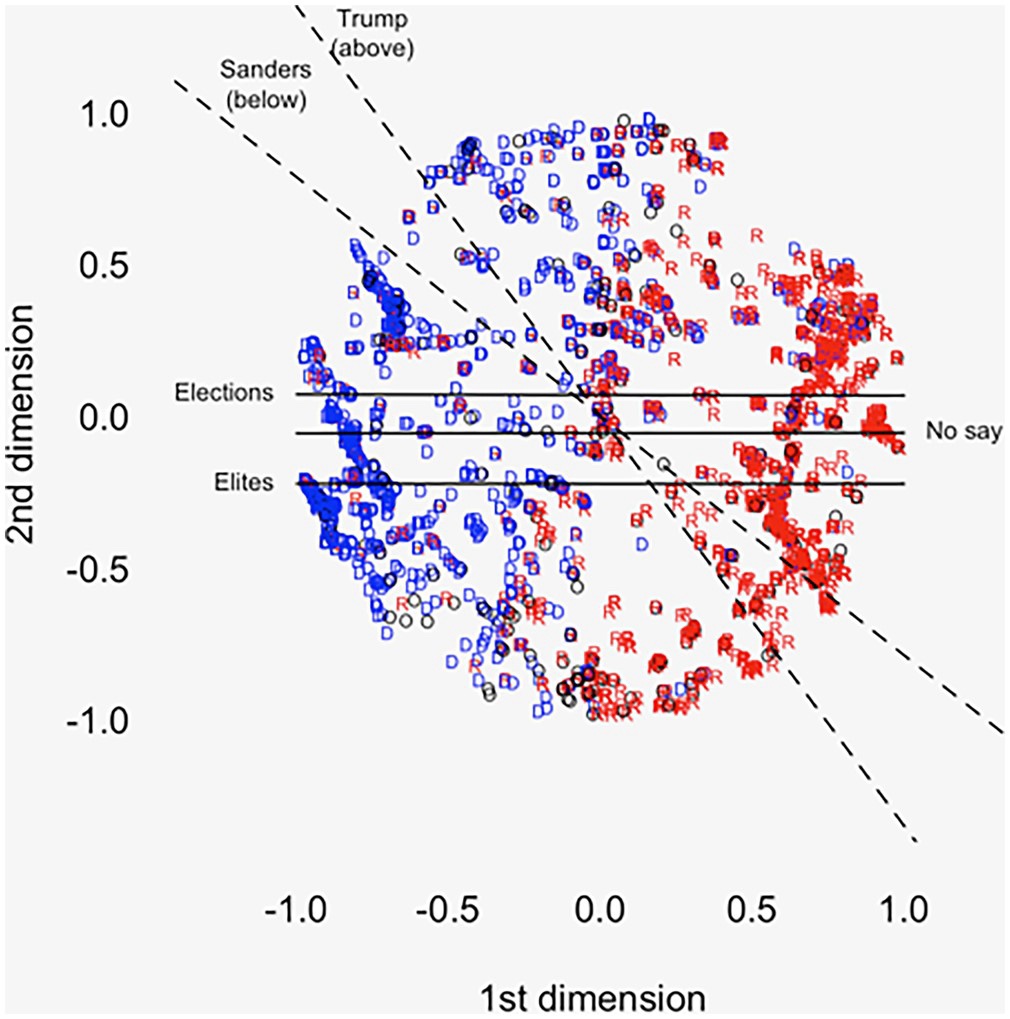
Let’s say we are asking voters to rank, approve of, or assign scores to candidates. Let’s assume that elites/activists are not urgingbullet voting. And let’s say those voters populate a two-dimensional space that looks like this. It represents the 2016 electorate.
The first dimension captures liberal-conservative policy views. I prefer to think of it as a major-party dimension. Note how Trump (red R) and Clinton voters (blue D) appear on the right and left, respectively.
The second most strongly captures measures of political discontent. Charles Franklin recently called this dimension (in Congress) institutional/anti-institutional. I like that.
There is no problem as long as candidates differentiate themselves along one or the other dimension. Voters can (in theory) rank/score candidates according to how far away they perceive those candidates to be. (I am less confident about this under an approval ballot, as that ballot cannot capture preference intensity.)
The problem arises when both dimensions are active at once — as in the figure. What does an anti-institutional liberal do when the only anti-institutional candidate is on the right side of the major-party dimension? What does an institutional conservative do when the only institutional candidate is on the left side of the major-party dimension?
This is where we could get into scenarios, questions about distance, questions about not voting, questions about the quality of the information environment, the idea of cross-pressure, and so on.
The simple answer to both questions above is “it depends.” That’s the point.