PR graphic for public use
Some have asked me to share a chart I made of PR’s history in American cities. Here it is.
by Jack Santucci
Some have asked me to share a chart I made of PR’s history in American cities. Here it is.
The United States is unique among democracies for the durability of its two-party system. Why in this context does electoral “reform” ever succeed?
Maine voters will decide in November whether to use the alternative vote (AV) for single-winner elections. AV lets voters rank candidates. If no candidate has an outright majority, voters’ lower rankings come into play. Many now call this “single-winner ranked choice voting.” Why does AV have traction? If it wins, how long can we expect it to last?
Is the single transferable vote a form of proportional representation? Right now I believe it is. A reviewer once said the fight had been won. Either way, this issue stops some of my talks dead in their tracks. Some are bothered that PR might coexist with candidate-based ballots.
If you are reading this, you know that 24 U.S. cities tried the STV form of proportional representation. Here is an updated chart summarizing those episodes.
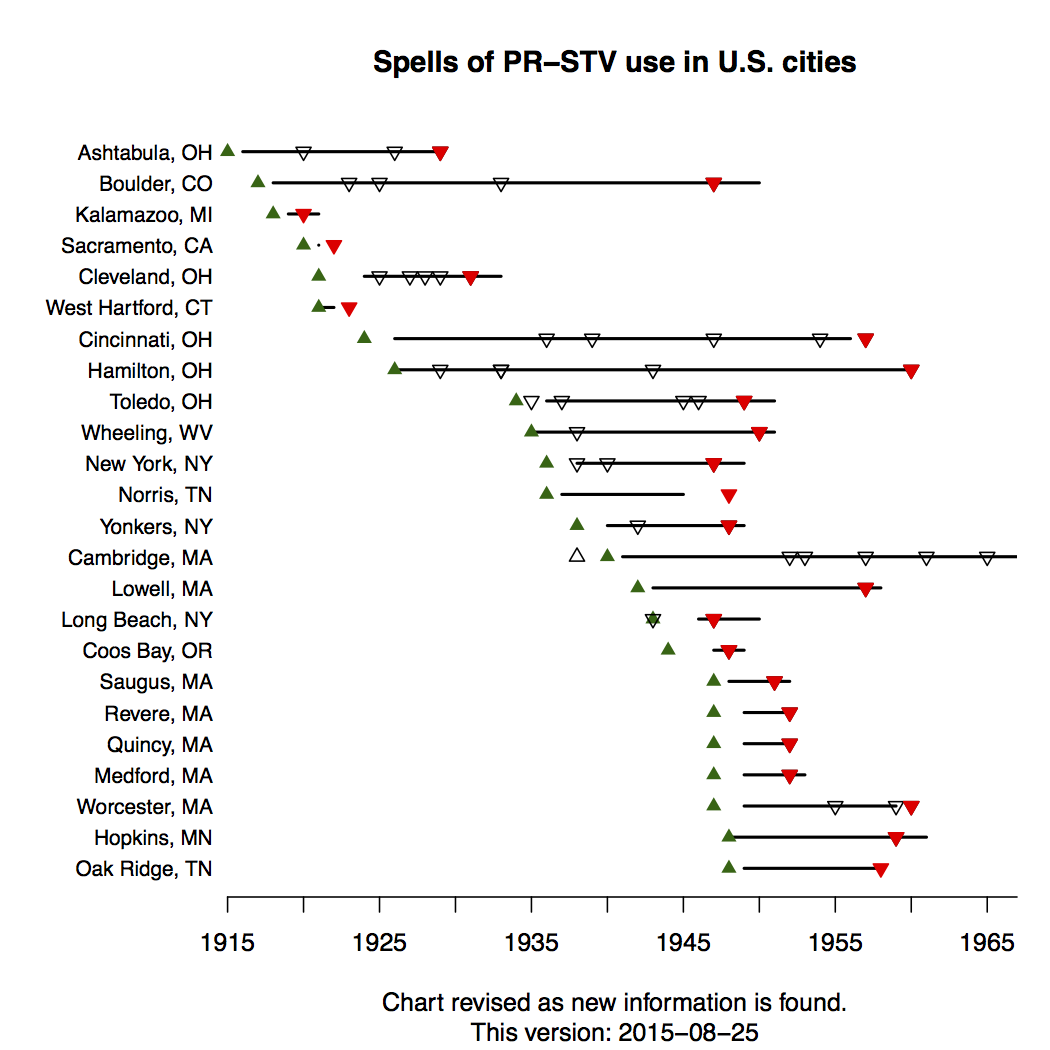
The changes include:
1) Cropping to 1965, since events thereafter are basically chartjunk.
2) Adding a failed 1959 repeal attempt for Worcester, MA.
3) Changing the dates for Oak Ridge, TN, which evidence suggests to have emerged with STV a decade later than I thought. Note that the Oak Ridge council was “advisory,” whatever that means.
4) Adding Norris, TN, which I had not included because I could not find the dates of any STV elections. This Town Council was also “advisory.” Elections were held annually from 1937 through 1945. I cannot find evidence of an STV election post-1945. The federal government sold Norris to a developer in 1948, and Tennessee granted Norris its own charter in 1949.
5) Date-stamping, since this chart may evolve gain.
Please share any suggested, further changes. Wouldn’t it be nice if our state and local politics were better documented?