When seeking to persuade people to go along with an electoral reform, it is common to suggest that first-past-the-post is old. Common variations on this theme include “antiquated voting system” and “18th-century voting technology.” This trope is anachronistic.
What was old in the countries these replaced is some combination of the following: multi-seat districts (including in Britain), two-round runoff elections, and virtually no party control of nominations. Some cases even had voice voting, as I learned this week. The single transferable vote (STV), which we hear is new technology, reflects the old order.
Scholars have been converging on a theory of electoral reform that runs roughly as follows: nomination control is the way to contain ‘populism,’ and this can be mixed with PR, plurality, or runoff.
This point starts to emerge from a 2010 article in Comparative Political Studies by Amel Ahmed, later expanded into a book. The point is that both PR and “single-member plurality (SMP)” — note the terminological difference from FPTP — were responses to a perceived threat of mass (socialist) mobilization in the late 19th century. Belgium turned to PR, and the United Kingdom went with SMP. Later work extendsthisexplanation to other continental democracies. It also starts to emphasize the role of list PR in boosting control of nominations, had any existed at all. As for Britain, Ahmed documents a range of other practices (like gerrymandering) that came with SMP, all meant to contain what would become the Labour Party. Later work suggests that incumbents did not need control of nominations because it already had existed since the 1830s.
A 2×2 table may help with the jargon I am starting to introduce. It is oversimplified but helps to make my point.
Seat allocation → Nomination control ↓
Proportional
Not proportional
Low
STV
SMP*
High
List PR
FPTP
*I am using “SMP” to keep things simple. It may make sense to use “SSD” (single-seat district) instead.
How might we think about the United States? Congress first mandated single-seat districts in 1842. That law is now seen as a way to prevent Jacksonian Democrats from maximizing seat share by switching to the ‘general ticket’ (multi-seat districts) in states under their control. Note that this did not enhance control of nominations. That possibility would not exist until introduction of the secret ballot. Thus it was not FPTP, and the major parties have remained ‘big tent’ (i.e., hospitable to ‘populism’).
STV enters the conversation in the 1850s as a way to “protect minorities” in multi-seat districts, along with cumulative voting and other non-list approaches to holding down majority seat share. Its popularity is mostly limited to the United Kingdom and its colonies. I have toyed with the idea that this popularity was due to a pre-existing tradition of party government, with associated levers of nomination control. STV might have ‘protected minorities’ without resort to SMP, at the same time rolling back control of nominations. That never happened.
FPTP and list PR are thus ‘new technology,’ whereas STV and nonpartisan runoffs are old.
Since this post is getting long, I will set aside Australia, except to note three things about STV: (1) its single-seat cousin (‘RCV’) came with compulsory ranking, (2) continued mass mobilization led to the addition of compulsory voting, and (3) STV came much later to the Senate for reasons other than a need to contain ‘populism.’
I have a new post on 3streams. It responds to an influential graph on the basis of some findings I published (with Joshua Dyck) in 2022.
Long-time readers will be familiar with this project. For the post, I took a second look at the ‘social’ attitudes of people we might think would appear in the top-left of the above.
Following up on yesterday’s post, here is a brief statement of the legislative reason for the repeal of the single transferable vote in US history. I have no reason think it would not apply to instant runoff as well. Both are fundamentally STV, and both are being promoted as a way to break up parties.
I have written elsewhere that STV opened the possibility of ‘vote leakage.’ Leakage usually refers to votes cast for one party but that help a different one win seats, via the transfer process.
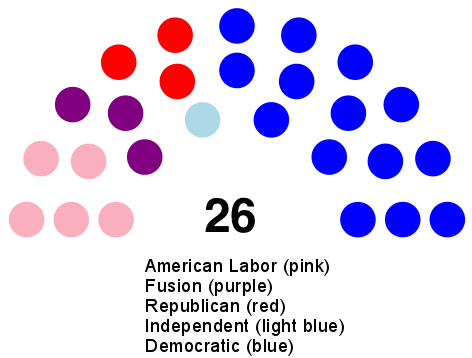
Connecting this phenomenon to STV repeal required tracking leakage betweencoalitions, not among parties. New York City illustrates the logic. There, votes were expected to leak among a series of anti-Tammany parties.
Apportionment diagram of New York City’s first STV-elected council, November 1937. Source: LSE USAPP, December 2016.
In other cases, local parties were formed to keep votes away from the rumps of parties displaced by the reforms. This was a direct response to problems organizing STV-elected legislatures.
Slate mailer from Worcester, Mass., early 1950s. Source: author’s archival research.
It didn’t work in the long run. Below is my go-to image for introducing people to the problem. It gives the percentage of roll-call votes in each legislative term on which some portion of said local party (Citizens’ Plan E Association or CEA in this case) teamed up with the opposition and thus defeated its own party’s position. This is known as a majority roll when we focus on the majority coalition, which the figure does. The link between the roll rate and STV repeal is clear. Chapter 7 here gives a detailed account of this and other such episodes, linking them to vote leakage as well.
Here’s why this is an issue for advocates. Let’s say the point of current reforms is to bring Republican moderates into coalition with Democrats. That would be analogous to the reason for the CEA above. What the graph shows is the reform failing to bind that coalition. It shows the reform eventually doing the opposite of what it was supposed to do.
This is one reason why I recommended party-list systems and maybe ‘fusion voting’ instead of STV and its derivatives. (Others have been equity and ease of implementation.)