In a ranked-choice election, ballot exhaustion refers to the share of ballots that do not continue to the final round of counting. A ballot exhausts because the voter has not ranked a front-runner (should one exist). Analyses of single-seat elections sometimes show that, due to ballot exhaustion, the winner was not supported by a majority of voters. According to FairVote, this has occurred in 27.6 percent of modern “instant-runoff” races (which had three or more candidates).
What about ballot exhaustion in multi-seat elections (i.e., under STV)? This is a concern for the seat-maximizing party (taken here to include multi-party coalitions and party-like entities). If ballots do not flow among co-partisans — e.g., due to bullet voting for only the most popular candidate(s) — ballot exhaustion can be blamed for having changed a seat distribution. (I will not cover vote leakage here, which is a separate but related issue.)
The plot below gives rates of ballot exhaustion for three historic cases. Two of them, Cincinnati and Worcester (MA), were the subject of my 2018 article in Electoral Studies. Robert Winters provides the data for Cambridge (MA), which still uses STV. (See this blog post, with thanks to Mirya Holman, for a sense of more recent data.)
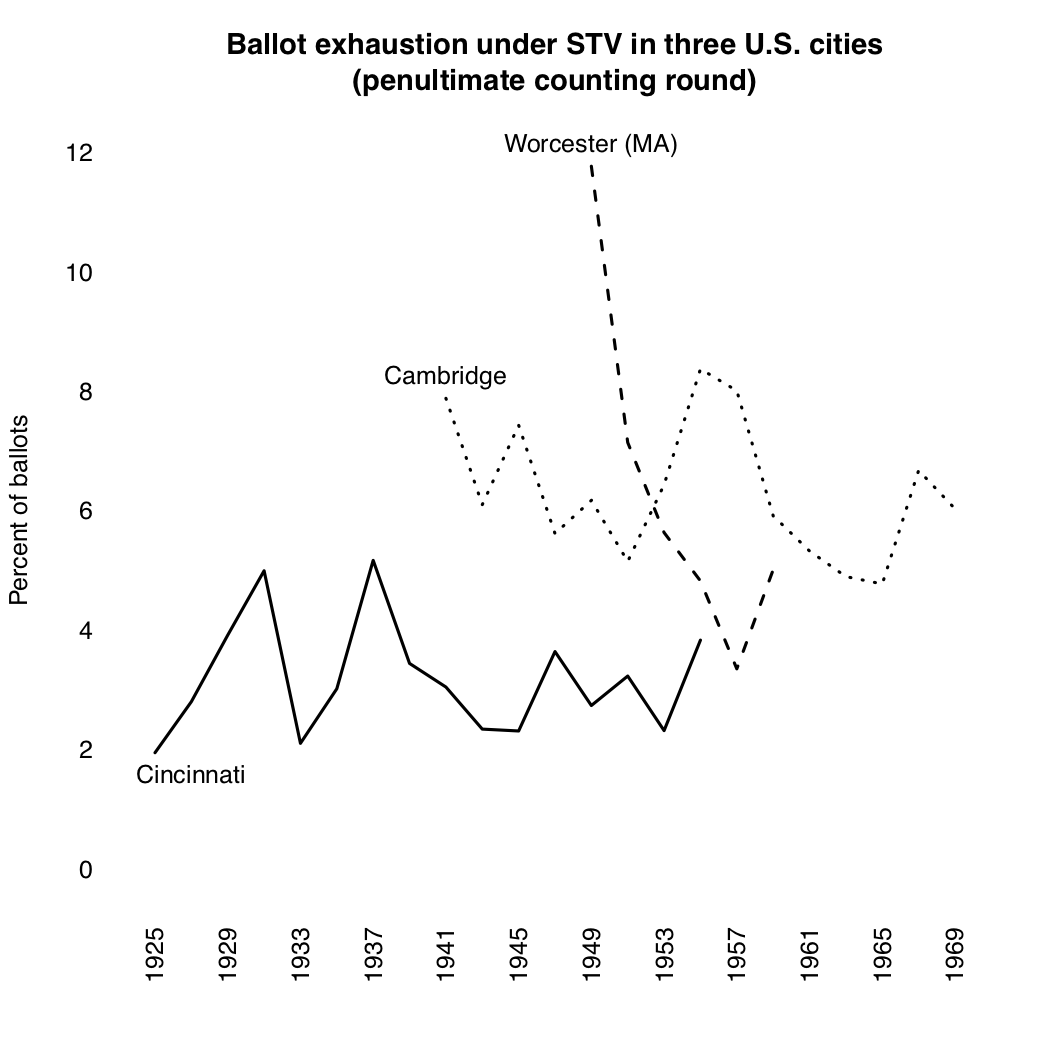
These figures are based on total ballots cast, not the valid-ballot totals, but a quick look at the data suggests they wouldn’t change too much (although they would be somewhat higher).
Also, these figures are based on exhausted ballots from the penultimate round of counting. Why? Say we have two parties squaring off. Competition is for the final seat, which either of these can win. Computing exhaustion from the final-round count would be akin to including votes for the ‘main loser’ in an IRV contest. Neither of the papers above does this.
I make no claims about what is a “normal” rate of ballot exhaustion under STV.
That said, it is possible to speculate about the variation. Worcester likely had the highest rates due to its weak Democratic Party (i.e., one that could not, for whatever reason, deter ‘excess’ candidate entry). Another factor in at least two cites was that large numbers of independents (and the very rare third party) often (but not always) ran hopeless campaigns, and their voters do not seem to have sent votes back to the “majors” (at least in large number). In Worcester’s first election, for example, there were 152 candidates to the nine-seat council (and 126 counting rounds, due to batch elimination). In Cincinnati, by contrast, the party organizations were both strong and adept at electioneering. Also, Cincinnati was a ‘movement model’ for STV adoptions elsewhere, so people took great pains to ‘get it right.’
I say more about all this in a very big project wrapping up. If ballot exhaustion matters, there are ways to deal with it. Here’s one. Here’s another — although it is not the main reason for that proposal.